 DORA METRICS
DevOps Research Assessment - DORA has found that a team’s software delivery capability reliably predicts the value that the team provides to their organization. Delivery capability of a team can be assessed using the DORA metrics - deployment frequency, lead time to change, change failure rate, mean time to recover.
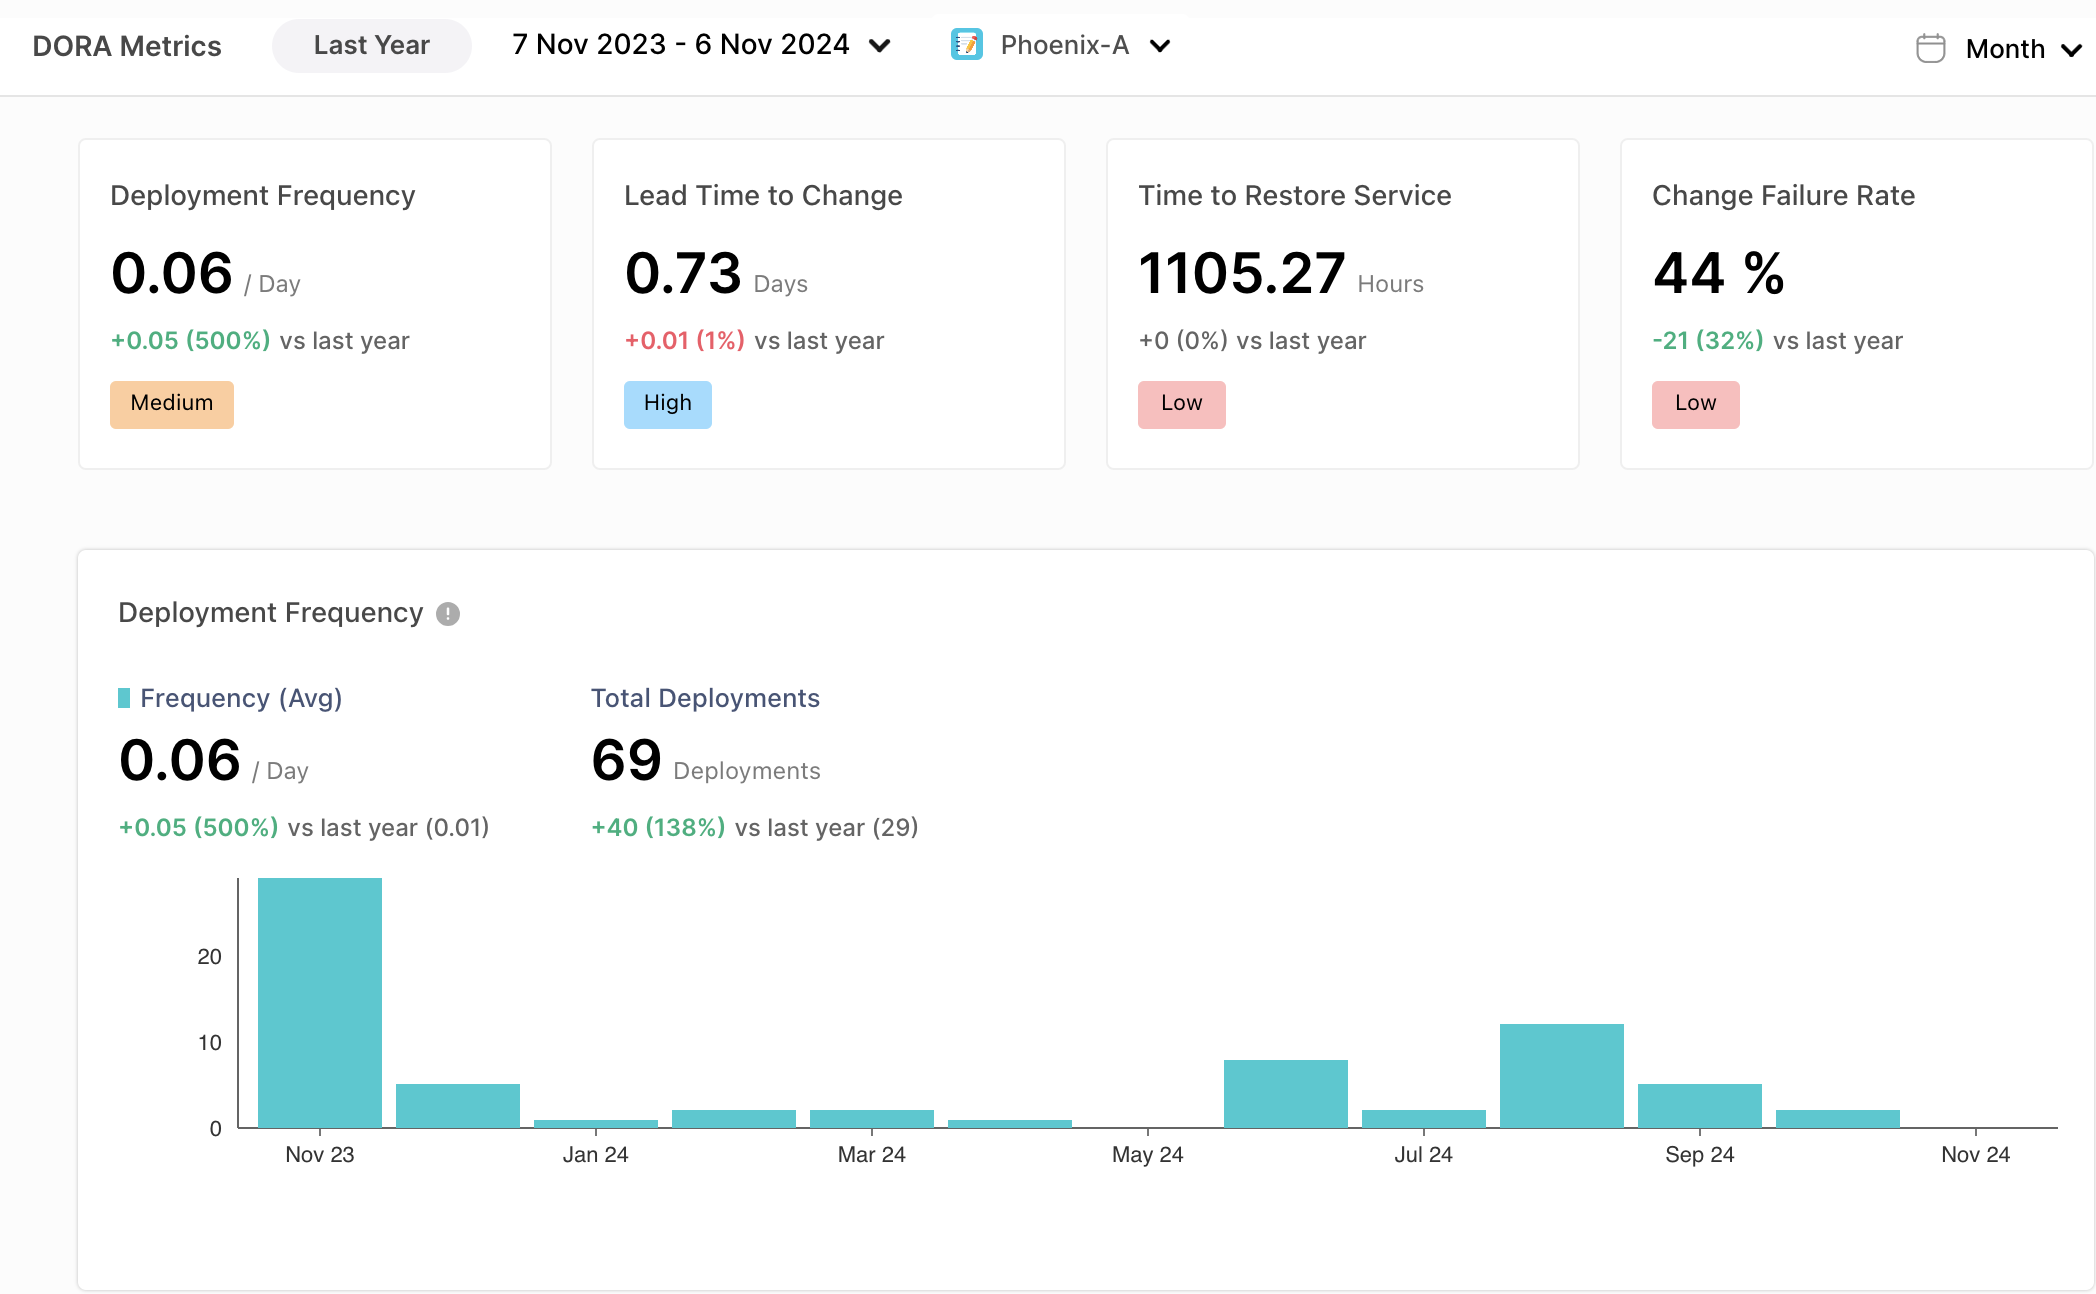
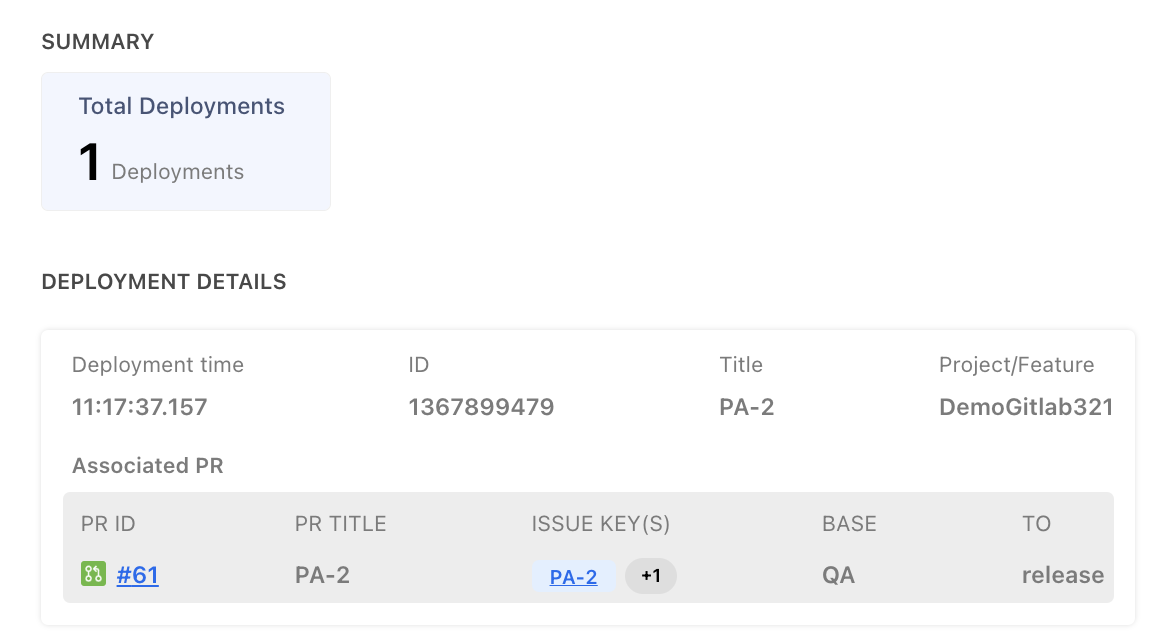
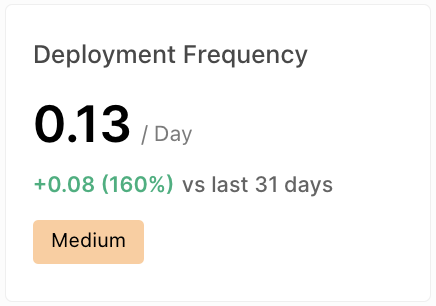
Measures how often new code is deployed to a production environment.
This metric correlates with the speed and the quality of your engineering team.
It tracks how quickly teams can release new features or bug fixes.
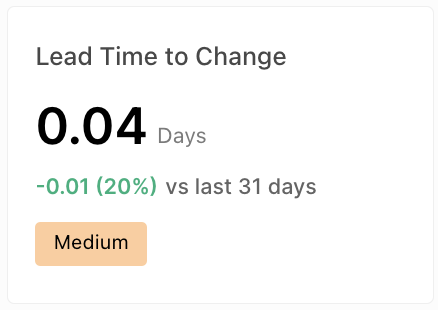
The time taken to go from code committed to code successfully running in production.
The average time it takes to recover from a product or system failure.
This includes the full time of the outage—from the time the system or product fails to the time that it becomes fully operational again.

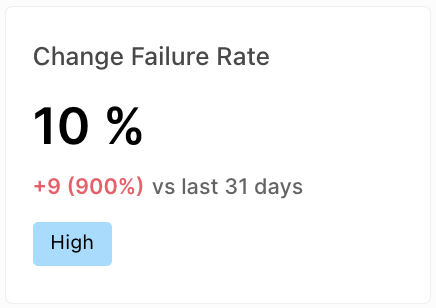
The percentage of changes that result in unintended consequences, such as downtime, errors, or negative impact on users.
It is calculated by dividing the number of failed changes by the total number of changes made over a specific time.
By connecting the appropriate 3rd party tools to Kine, you can compute DORA metrics for your programs/projects/teams. It will help you:
