Bug Trends
Bug Trends & Insights
Understand patterns across sprints, modules, and resolution cycles.
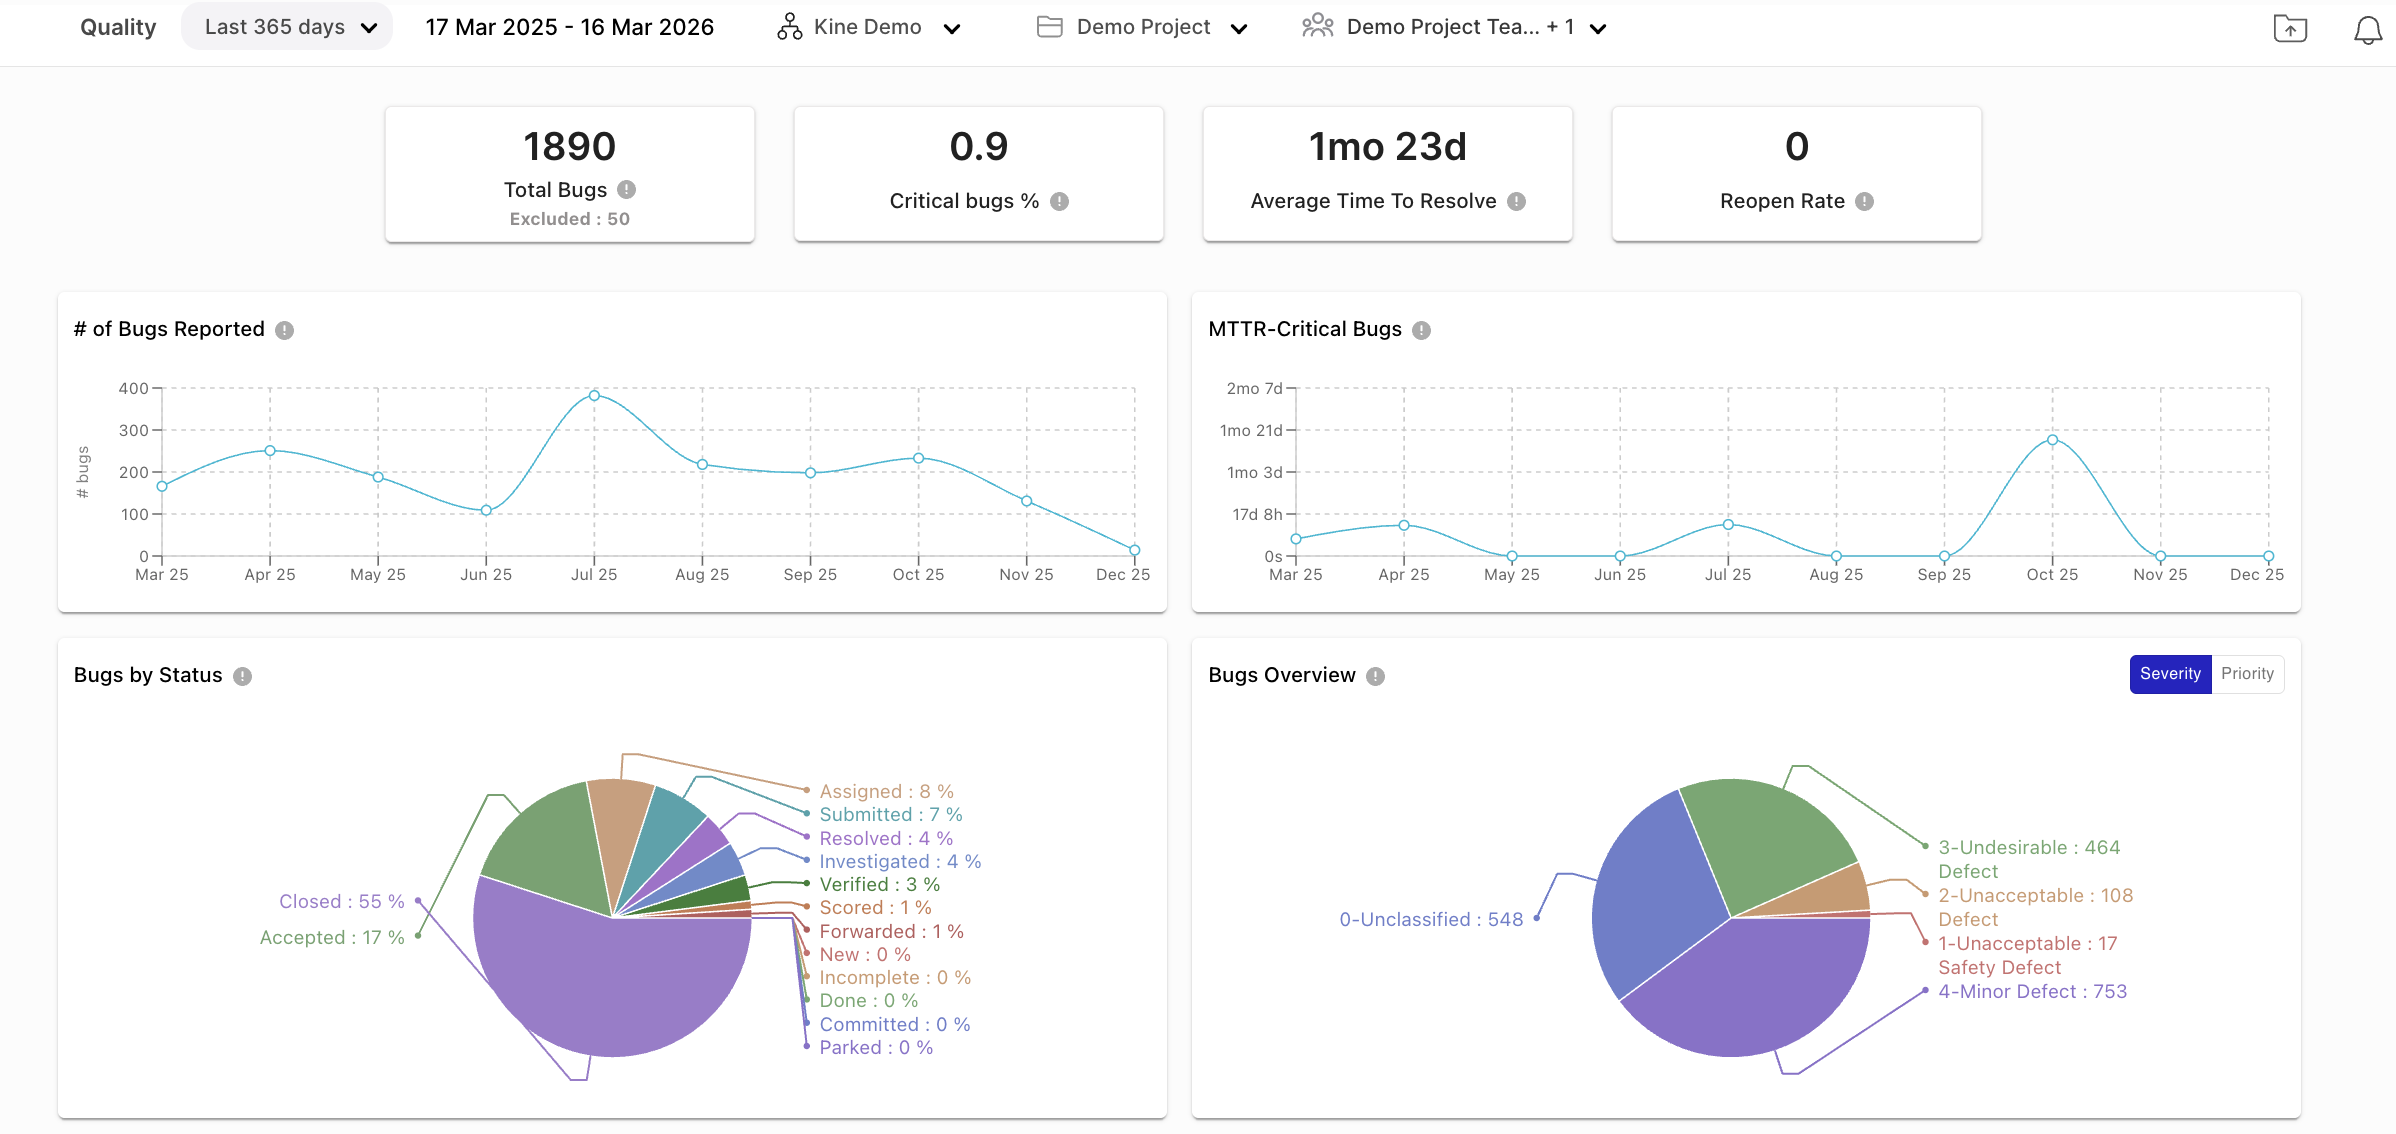
The Quality Dashboard provides deep visibility into defect trends, resolution efficiency, and engineering responsiveness so teams can deliver stable and reliable software.
Track engineering health through key bug management indicators.
Understand patterns across sprints, modules, and resolution cycles.
Actionable defect insights that improve stability, reduce risk, and accelerate delivery.
Identify product stability risks before they reach production.
Detect functional areas with high defect concentration and act fast.
Improve responsiveness to critical incidents with real-time data.
Reduce defect leakage into production through better tracking.
Accelerate root cause analysis and resolution cycles.
Support engineering and release decisions backed by real quality data.
Monitor backlog health, identify bottlenecks, and allocate resources effectively.
Track defect discovery patterns and improve testing effectiveness.
Understand stability trends and prioritize quality improvements.
Gain strategic visibility into engineering quality and delivery risk.
Get full visibility into defect trends, resolution efficiency, and engineering responsiveness — all in one place.
Request a Demo