Velocity & Throughput Metrics
Understand your team's delivery capacity with real-time velocity tracking, throughput analysis, and sprint performance insights that help you plan better and deliver more consistently.
Understand your team's delivery capacity with real-time velocity tracking, throughput analysis, and sprint performance insights that help you plan better and deliver more consistently.
Track these metrics to understand your team's delivery rhythm and forecast capacity accurately.
Story Points
Story Points
Last 5 Sprints
Rate
Items/Sprint
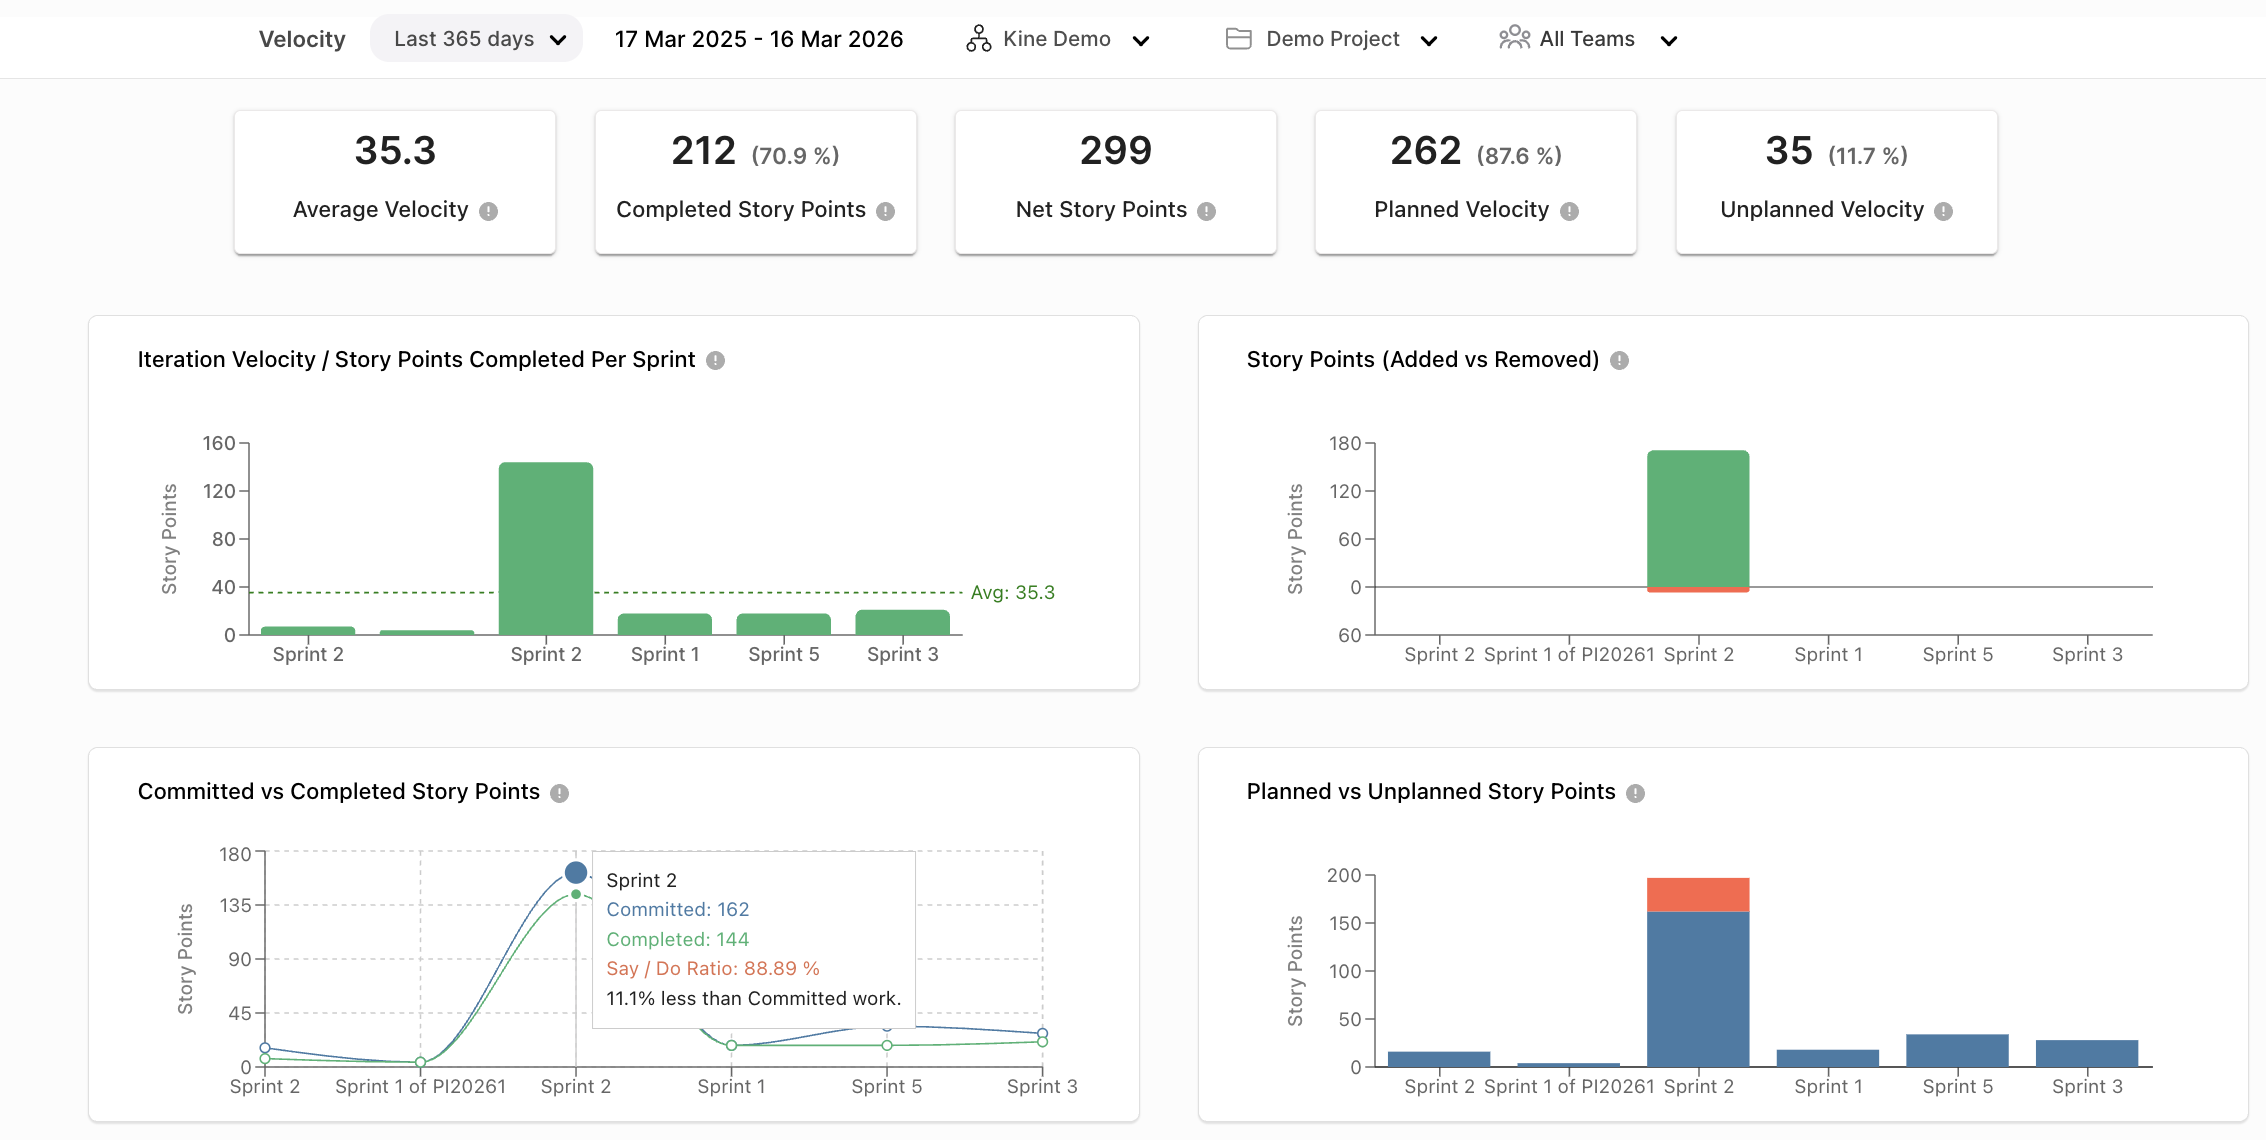
Velocity represents the amount of work a team completes during a sprint or iteration. It is calculated using completed work items that meet the team's Definition of Done.
Use velocity for sprint planning and capacity forecasting — but remember, it's most meaningful when tracked consistently over time within a single team.
| Metric | Description |
|---|---|
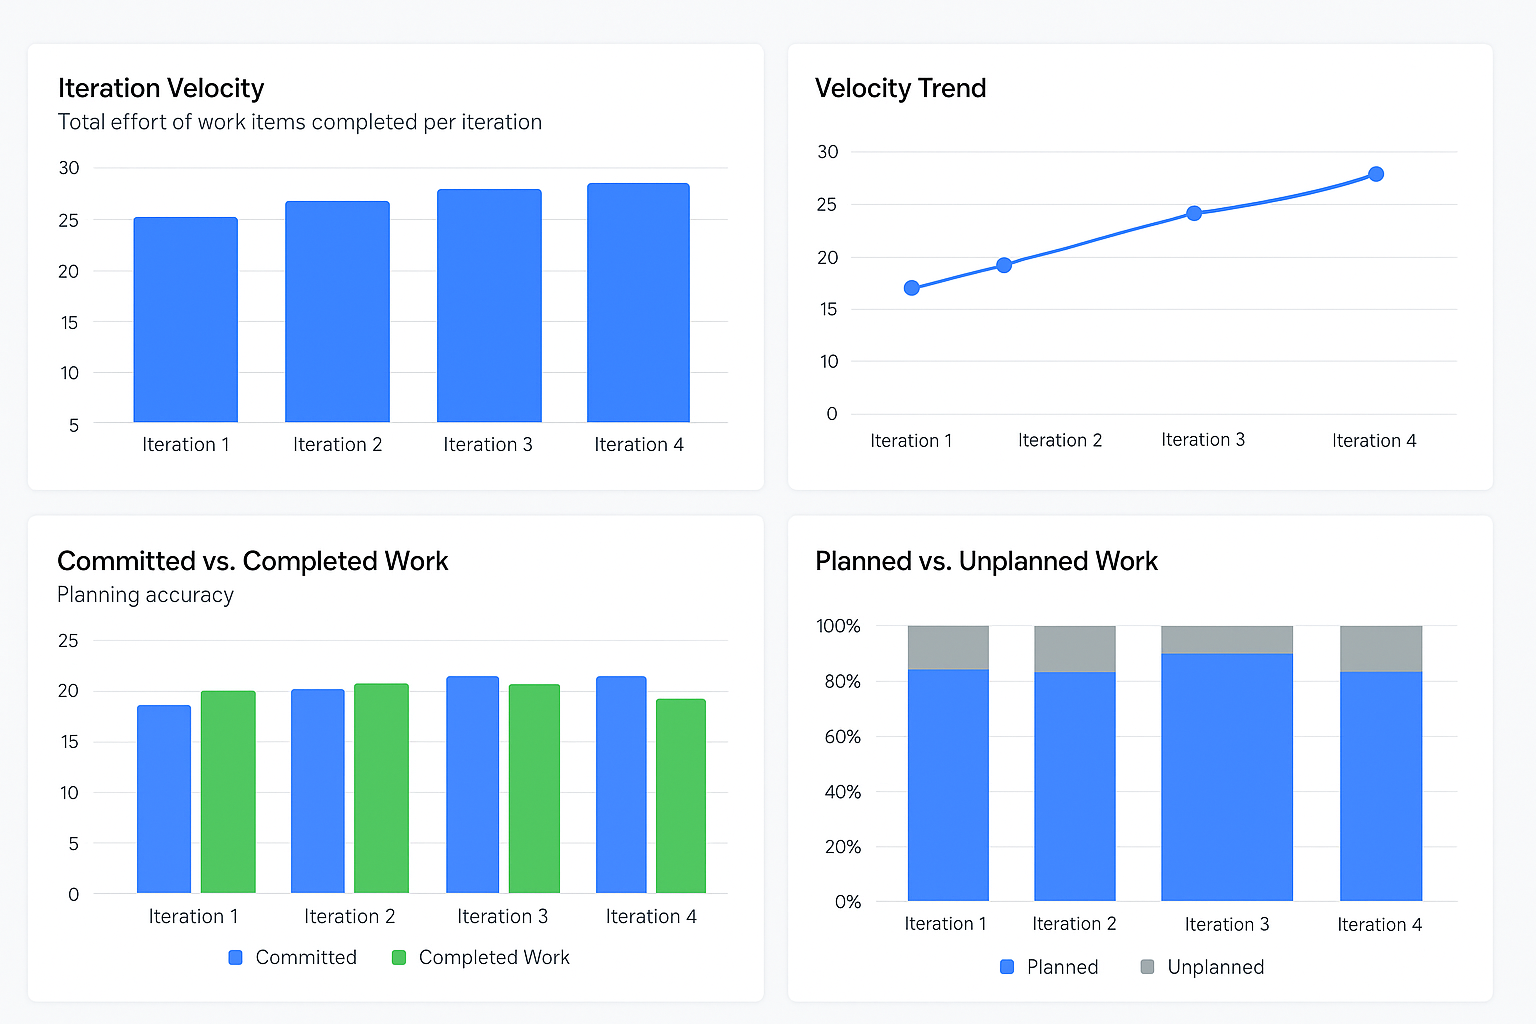
| Planned Velocity | Total story points committed at sprint planning |
| Actual Velocity | Total story points completed in the sprint |
| Average Velocity | Average velocity from last 3–5 sprints |
| Committed vs Completed | Measures delivery against commitment |
| Spillover Rate | Work moved to the next sprint |
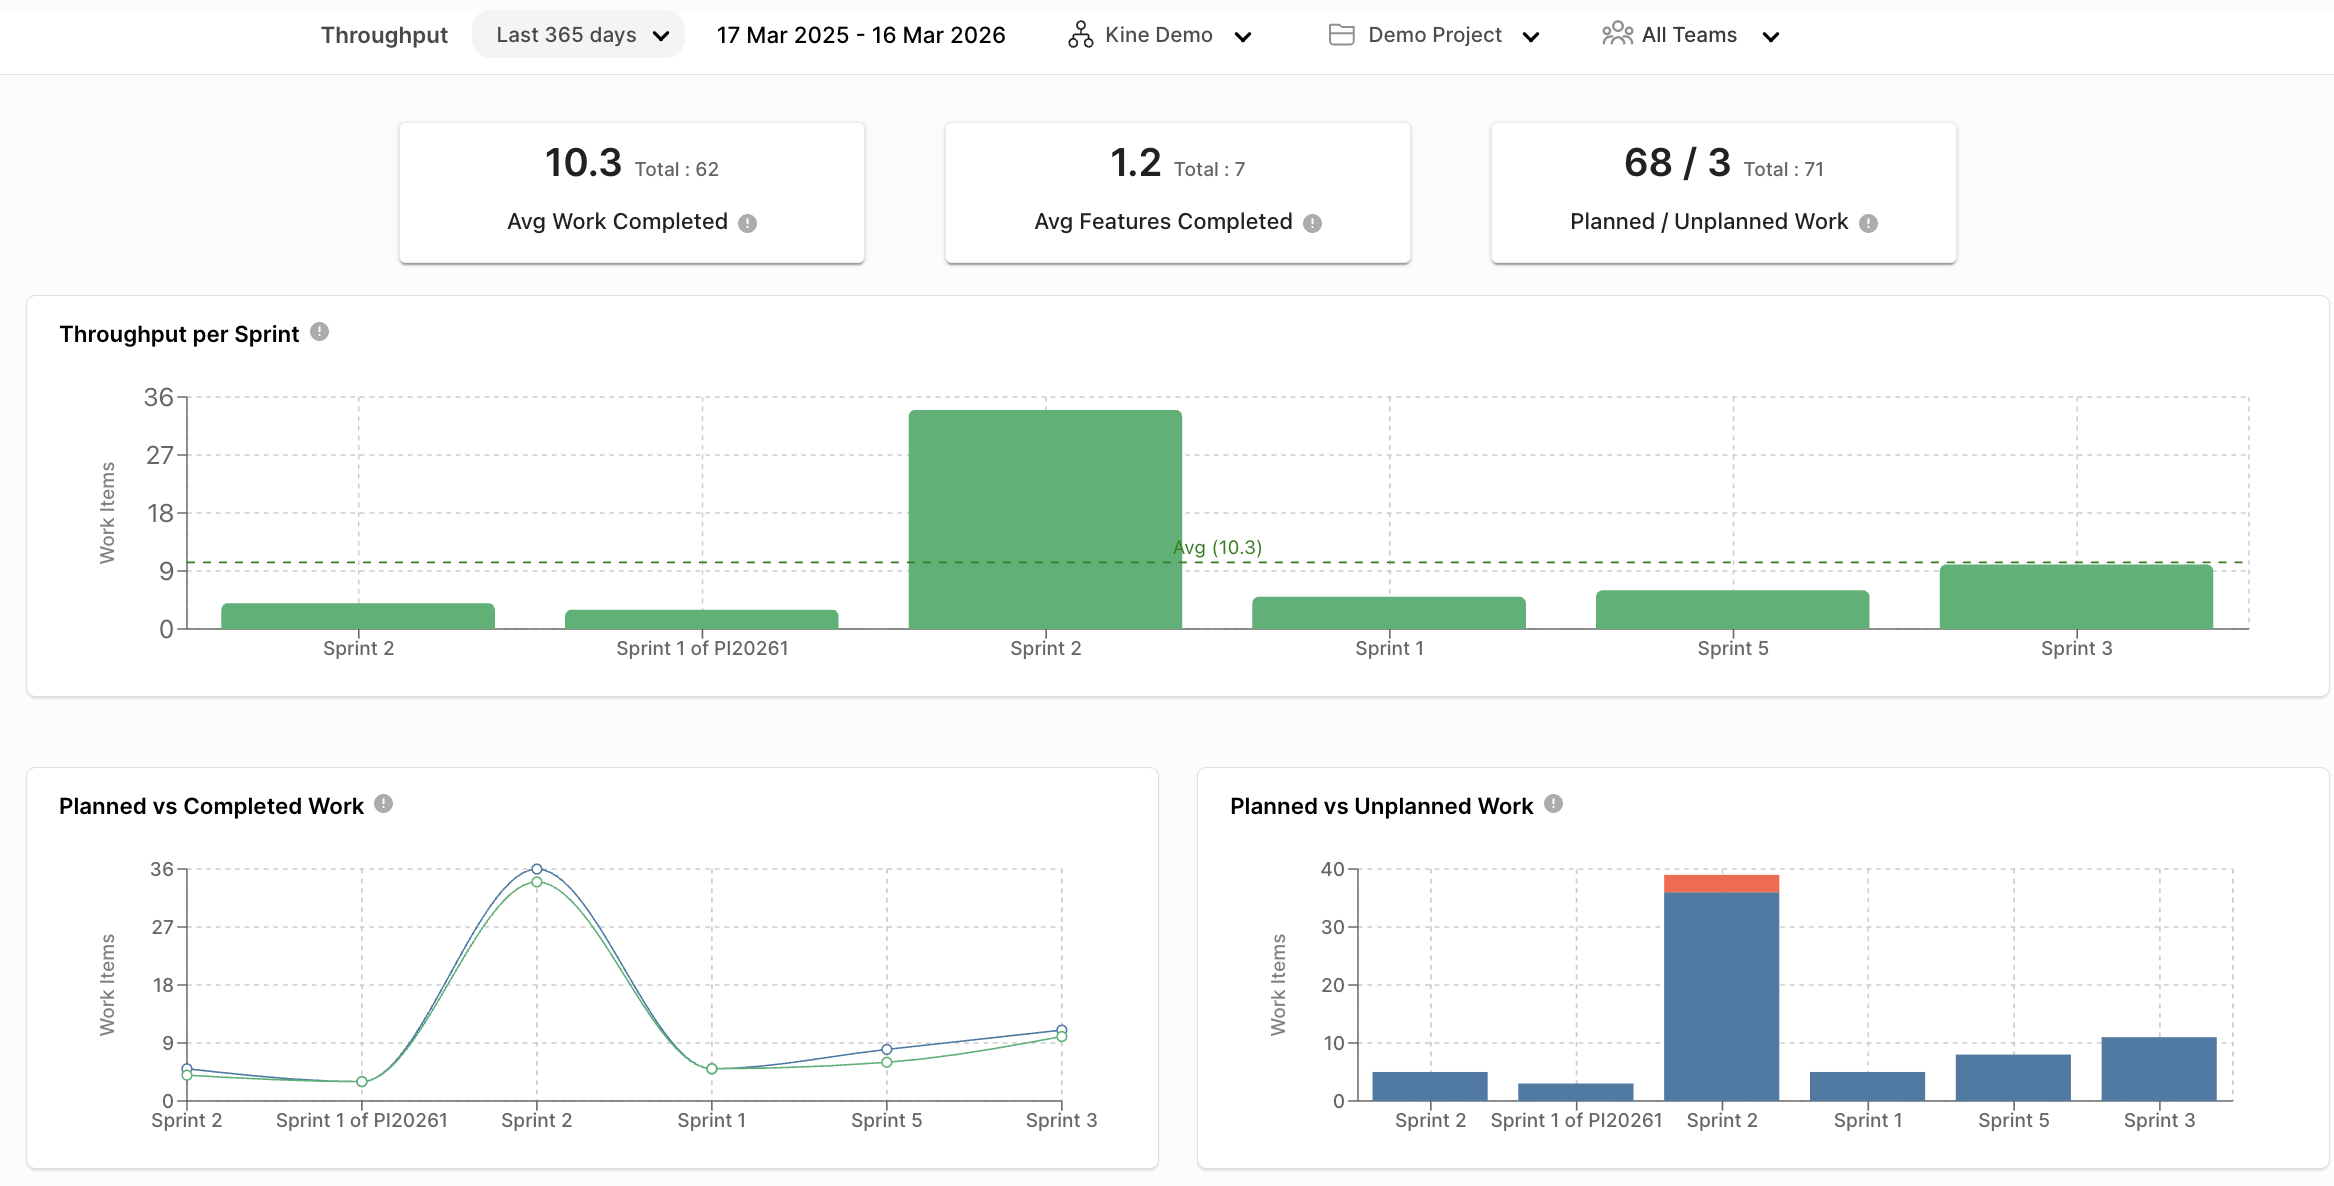
Throughput measures work items completed during a time period — focusing on item count rather than effort estimation. It provides a more objective view of delivery capacity.
Unlike velocity, throughput is easier to compare across teams since it doesn't rely on subjective story point estimates.
| Metric | Description |
|---|---|
| Total Items Completed | Total number of completed tasks, bugs or stories |
| Weekly / Daily Throughput | Items completed per day or week |
| Throughput by Type | Breakdown by feature, bug, or technical task |
| WIP Count | Items currently being worked on |
Understanding when to use each metric for planning and delivery tracking.
| Aspect | Velocity | Throughput |
|---|---|---|
| Unit | Story Points / Effort | Number of Work Items |
| Focus | Team Capacity | Work Flow Efficiency |
| Usage | Planning & Forecasting | Delivery Speed Tracking |
| Comparison | Not recommended across teams | More comparable |
Granular signals of development health and CI/CD pipeline effectiveness.
Shows development contribution activity in a sprint.
Measures completed code integrations.
Identifies rewritten code and instability.
CI/CD pipeline activity and build frequency.
Improvement in automated testing coverage.
Time from code commit to production deployment.
Get accurate velocity and throughput metrics that help your teams plan better and deliver more consistently.
Request a Demo