DORA Metrics
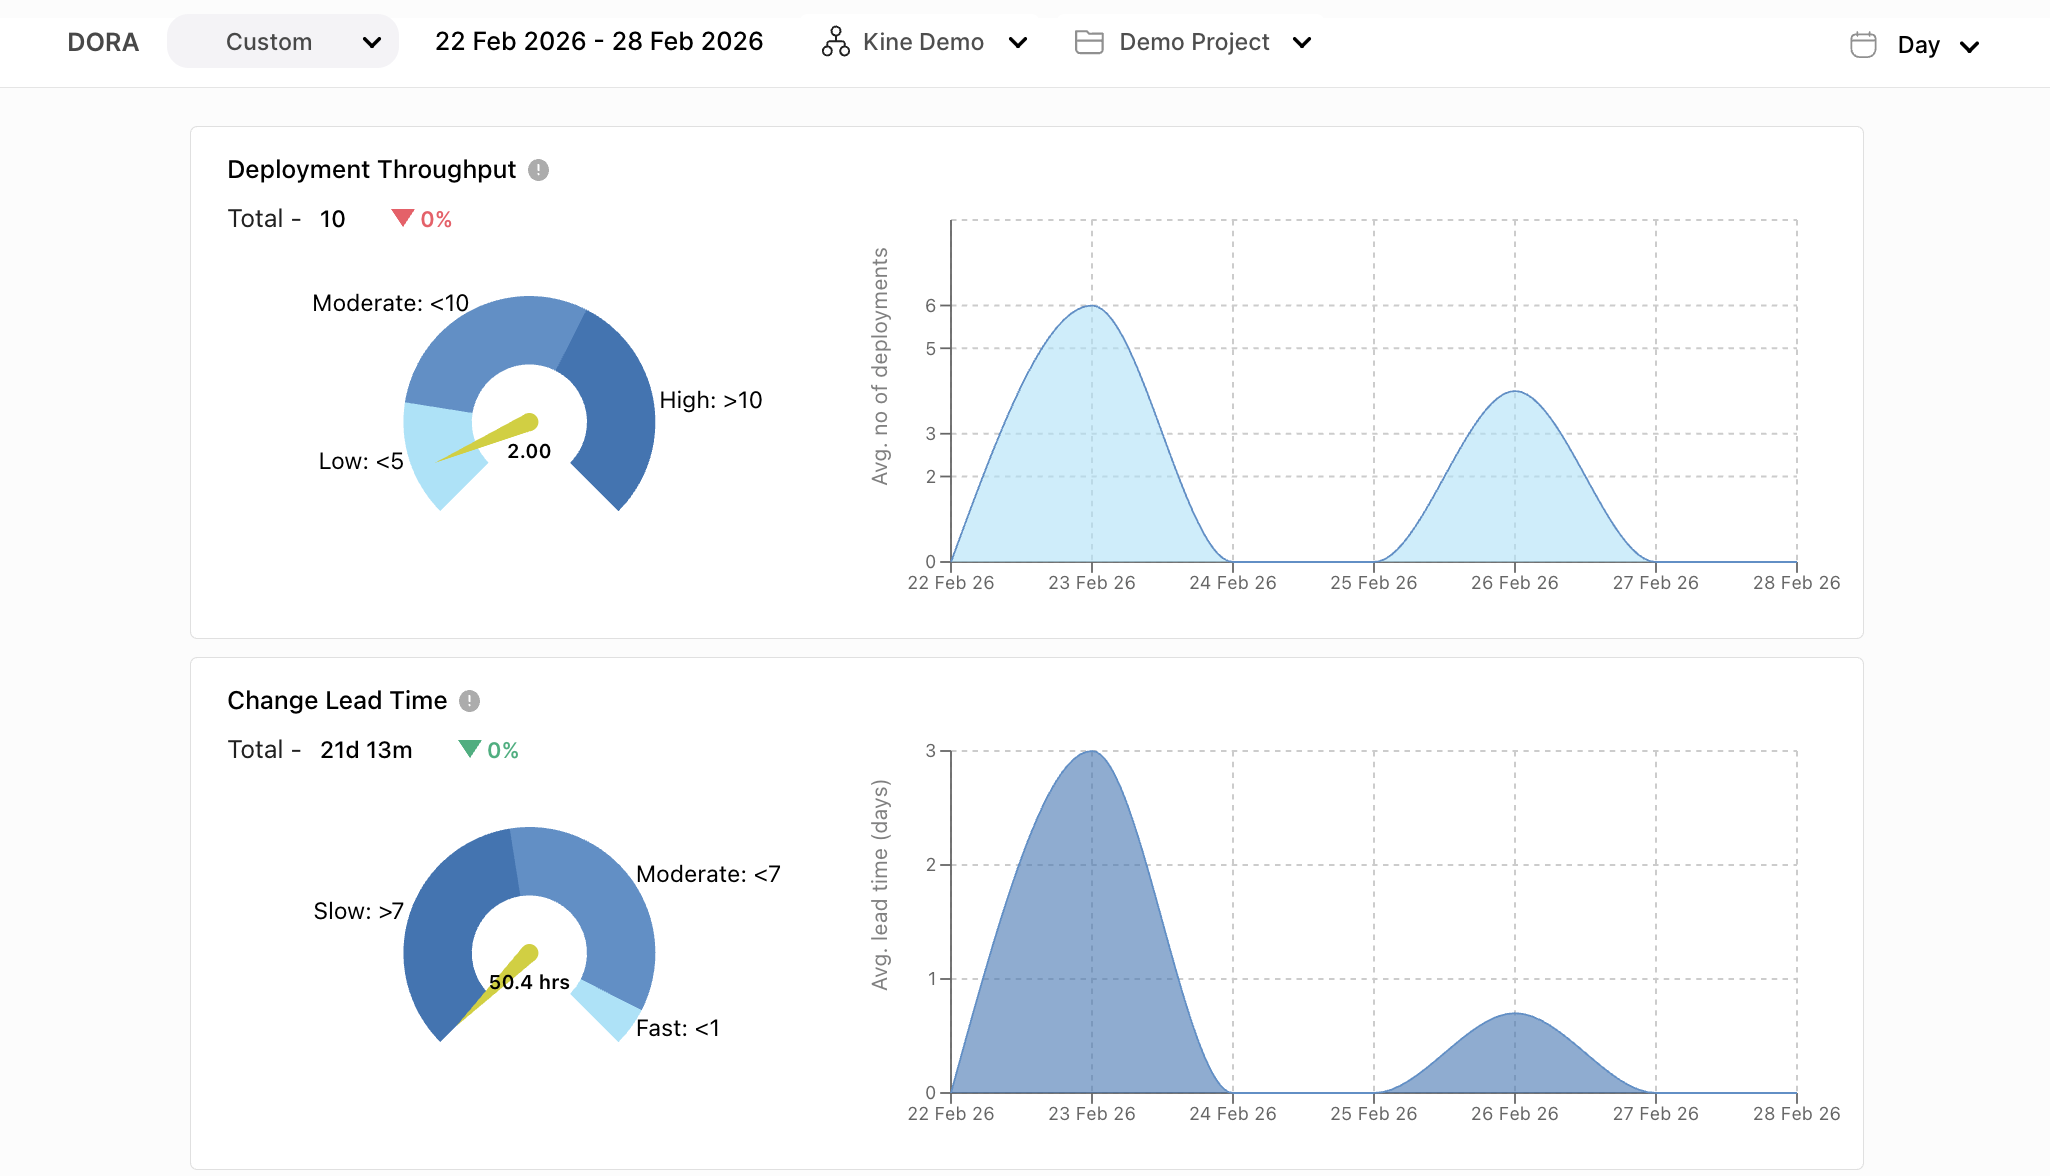
Track deployment efficiency, delivery speed, and system reliability using industry-standard DORA metrics. Gain visibility into your engineering pipeline and identify opportunities to improve deployment stability and throughput.
Four key metrics that define elite software delivery performance.
A real-time view of deployment activity across services and environments.
| Deployment ID | Service | Environment | Status | Date | Owner |
|---|---|---|---|---|---|
| DEP-1041 | Notification Service | Production | Success | Mar 10 2026 | DevOps Team |
| DEP-1042 | Billing API | Production | Success | Mar 11 2026 | Platform Team |
| DEP-1043 | Search Service | Production | Failed | Mar 11 2026 | Backend Team |
| DEP-1044 | User Profile | Production | Success | Mar 12 2026 | API Team |
DORA metrics provide a standardized way to evaluate and improve software delivery performance across the organization.
Understand bottlenecks, reduce deployment delays, and improve velocity through data-driven insights.
Monitor pipeline stability, detect failure patterns, and optimize CI/CD infrastructure.
Track delivery performance across projects while ensuring productivity and quality improvements.
Gain visibility into delivery predictability and system reliability for better strategic decisions.
Configure your own DevOps performance benchmarks and compare real deployment performance against expected targets.
| Metric | Configured Benchmark | Actual Performance | Status |
|---|---|---|---|
| Deployment Throughput | 8 Deployments / Day | 7 Deployments / Day | Near Target |
| Change Lead Time | < 24 Hours | 18 Hours | On Target |
| Recovery Time | < 4 Hours | 2.5 Hours | Exceeds Benchmark |
| Deployment Failure Rate | < 10% | 8% | Healthy |
Understand where your delivery performance stands and start improving with DORA-powered insights from Kine.
Request a Demo